Cell Nucleus Classification & Segmentation
The group “molecular cytogenetics” at the Institute of Human Genetics, Klinikum Rechts der Isar, employs fluorescence in situ hybridization (FISH) for the analysis of human chromosomes. FISH offers the opportunity to specifically stain any region within a genome and to visualize the respective region on both metaphase spreads and in interphase nuclei. A specialty of the group is multicolor-FISH, i.e. the simultaneous hybridization of multiple probes each labeled with a different color. The application of appropriate microscopy equipment and imaging software allows sophisticated 3D microscopy. Several images at different z-levels are collected and the images processed with deconvolution and 3D-reconstruction software. However, multicolor-FISH in intact interphase nuclei poses an especial challenge, as several image analysis problems have not yet been solved. These problems include the segmentation of hybridized DNA-probes, which may be labeled with a single color or with a combination of multiple different fluorochromes, and the correct classification of these probes. Thus, the aims of this project are the development of algorithms for the segmentation and color classification of fluorescent signals in a 3D-space (cell nucleus). The perspectives include a tool, which will be of importance for both, basic research and diagnostic applications. The student will work in collaboration with CAMP and the Human Genetics Group at Klinikum Rechts der Isar .
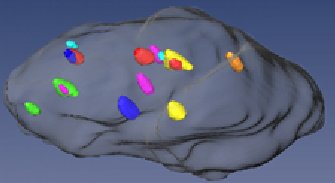
Example: Colon cell nucleus with fluorescent probes for chromosomes 3 (green), 4 (light blue), 7 (orange), 8 (pink), 17 (yellow), 18 (dark blue), and 20 (red). This analysis allows firstly to establish the copy number of the respective chromosomes and secondly their position in the nucleus. Additinal information: The project aims on the connection between a cell an a signal. There are microscope picture ((100 - 800)² as resolution) with several cells as the object with a different focus plane (deconvulated, 30 - 60 planes) and different color filter (3 - 7 flurochromes and corresponding filters). There is actually the work for the researcher to count all signals that can be found in the cells, and come over this count to information about irregularities in the genetic material of the patient, which can significate some diseases. This work should be done automatically. The major problem was to segment the cells from each other and find a border, that defines if a signal is in a cell or more in another. To help the researcher to find out where the cells are located on a picture, there was used one flurochrome that colored all the nucleus, in difference to the rest of the signals, that color only some thousand base pairs of the DNS. In this images the cells come out as bright forms nearly elliptic, like can be seen on one of the added pictures. For further information read the projects summary or download the program here
| ProjectForm | |
|---|---|
| Title: | Cell Nucleus Classification & Segmentation |
| Abstract: | The group “molecular cytogenetics” at the Institute of Human Genetics employs fluorescence in situ hybridization (FISH) for the analysis of human chromosomes. FISH offers the opportunity to specifically stain any region within a genome and to visualize the respective region on both metaphase spreads and in interphase nuclei. A specialty of the group is multicolor-FISH, i.e. the simultaneous hybridization of multiple probes each labeled with a different color. The application of appropriate microscopy equipment and imaging software allows sophisticated 3D microscopy. Several images at different z-levels are collected and the images processed with deconvolution and 3D-reconstruction software. However, multicolor-FISH in intact interphase nuclei poses an especial challenge, as several image analysis problems have not yet been solved. These problems include the segmentation of hybridized DNA-probes, which may be labeled with a single color or with a combination of multiple different fluorochromes, and the correct classification of these probes. Thus, the aims of this project are the development of algorithms for the segmentation and color classification of fluorescent signals in a 3D-space (cell nucleus). The perspectives include a tool, which will be of importance for both, basic research and diagnostic applications. |
| Student: | Uli Klank |
| Director: | Nassir Navab |
| Supervisor: | Wolfgang Wein, Andreas Keil |
| Type: | IDP |
| Status: | finished |
| Start: | 2005/11/15 |
| Finish: | 2006/04/15 |