SEP:
Assessment of Knee Cartilage Thickness using
Magnetic Resonance Imaging
Student Research Project Details
| Student: | Lorenz König |
| Supervisor: | Prof. Nassir Navab |
| Advisor: | Ben Glocker |
| Project finished: | 2007 |
Abstract
Degeneration of knee joint cartilage is an important and early indicator of osteoarthritis (OA) which is one of the major socio-economic burdens nowadays. Accurate quantification of the articular cartilage degeneration in an early stage using MR images is a promising approach in diagnosis and therapy for this disease. Particularly, volume and thickness measurement of cartilage tissue has been shown to deliver significant parameters in assessment of pathologies. This project was aimed at analyzing and visualizing local thickness, notably in patellar cartilage. The resulting tools allowing for thickness-to-color mapped rendering of cartilage struktures have been integrated in the “PaCaSe” software.Materials and Methods
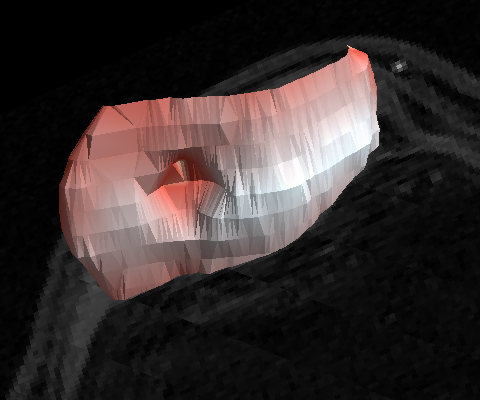
Any thickness evaluation of structures in raster images requires these structures to be segmented. For the purpose of this project, the segmentation as yielded by the semi-automatic tools incorporated in the “PaCaSe” software was used. Such segmentation data sets consist of a set of parallel two-dimensional planes (slices), in each of which the cartilage is delineated by polylines. These polylines, in turn, are marked as appendent to the cartilage-bone interface and the cartilage surface, respectively. In order to assess thickness in three dimensions, the slice-by-slice contours have to be transformed into a 3D model. Hence, a data structure for boundary-representing 3D objects by triangluar meshes that are closed, but may consist of multiple fragments (here: cartilage-bone interface and cartilage surface), has been developed. Operations implemented on these meshes include closest point and point-to-mesh distance. Thereupon, an algorithm for thickness measurement has been built, assinging each vertex of a given mesh fragment the (local) distance to another fragment. Fig. 1: Rendering of patellar cartilage surface extracted from MRI data set (shown in correct position in the background). Colors indicating cartilage thickness chosen as to give anatomical impression (red: zero thickness; white: maximum thickness). Simulated severe cartilage lesion. (click image to enlarge)
Literature
Ben GlockerDiscrete Optimization and Uncertainty Estimation in Non-rigid Image Registration
Technical Report, TUM-I0307, Technichal University of Munich, January 2007
Guido Gerig, Matthieu Jomier, Miranda Chakos
Valmet: A new validation tool for assessing and improving 3D object segmentation
International Conference on Medical Image Computing and Computer-Assisted Intervention (MICCAI 2001)
J. Folkesson, E. Dam, O.F. Olsen, P. Pettersen, C. Christiansen
Automatic Segmentation of the Articular Cartilage in Knee MRI Using a Hierarchical Multi-class Classification Scheme
International Conference on Medical Image Computing and Computer-Assisted Intervention (MICCAI 2005), 2005
C. Kauffmann, P. Gravel, B. Godbout, A. Gravel, G. Beaudoin, J. Raynauld, J. Martel-Pelletier, J. Pelletier, J. de Guise
Computer-aided method for quantification of cartilage thickness and volume changes using MRI: validation study using a synthetic model
Biomedical Engineering, IEEE Transactions on, 2003, 50, 978-988
| Students.ProjectForm | |
|---|---|
| Title: | Assessment of Knee Cartilage Thickness using Magnetic Resonance Imaging |
| Abstract: | Degeneration of knee joint cartilage is an important and early indicator of osteoarthritis (OA) which is one of the major socio-economic burdens nowadays. Accurate quantification of the articular cartilage degeneration in an early stage using MR images is a promising approach in diagnosis and therapy for this disease. Particularly, volume and thickness measurement of cartilage tissue has been shown to deliver significant parameters in assessment of pathologies. This project was aimed at analyzing and displaying local thickness data, notably in patellar cartilage. The resulting tools have been integrated in the “PaCaSe” software. |
| Student: | Lorenz König |
| Director: | Prof. Nassir Navab |
| Supervisor: | Ben Glocker |
| Type: | SEP |
| Area: | Registration / Visualization, Segmentation |
| Status: | finished |
| Start: | |
| Finish: | |
| Thesis (optional): | |